Showing posts with label Project Management. Show all posts

Variance At Completion

In project management, variance represents the difference between what was planned and what actually occurred. Cost variance, in particular, highlights whether a project is spending more or less than expected and often triggers corrective actions when deviations become significant.

Key Terms at Time Now

  • Ei — Initial Estimate The planned or estimated budget at the start of the project.

  • A — Actuals The actual cost incurred to date.

  • E(t‑c) — Estimate‑to‑Complete The expected cost required to finish the remaining work.

  • E(a‑c) — Estimate‑at‑Completion The updated forecast of total project cost:

E(a-c)=A+E(t-c)
  • V(a‑c) — Variance‑at‑Completion The difference between the original estimate and the updated forecast:

V(a-c)=EiE(a-c)

Adjusting the Estimate at a Future Time (Time Now + T)

If, at a later point in the project, the variance becomes too large—indicating excessive error, drift, or cost discrepancy—then the project manager may decide to reset the baseline.

In that case:

Einew=E(a-c)current

This establishes a more realistic baseline for future tracking and improves the accuracy of ongoing performance measurement.

An approach to PMO (Program Management Office)

Objectives of presentation

  • What is a Program?
  • What is a Project?
  • What is an Operation?
  • Who is Program Management?
  • Why do we need Program Management?
  • Which tools does Program Management use?


Definition of Programs
  • According to PMI, a program is a group of projects managed in a coordinated way to obtain benefits not available from managing them individually. Many programs also include elements of ongoing operations.
Definition of Projects
  • Projects are initiated in response to a problem or to take advantage of an opportunity. They are defined as a temporary endeavor that consumes resources, incurs cost and produce deliverables over a finite period of time to achieve a specific goal. Projects come in all shapes and sizes. They can vary in length or complexity, but the above mentioned definition of a project holds true for all of them.
Examples of projects
  • Web and Mobile Applications
  • Organizational Process Re-Engineering
  • Relocation Of Facilities & Equipment
  • Designing A Web Enabled Systems
  • Developing New or Enhancing Existing Products
  • Migration from mainframe to a windows-based distributed client-server system
Operations
  • Operation type activities are similar to project activities in that they too produce deliverables, consume resources and incur cost. However they are on-going or repetitive in nature, hence they are not project activities or tasks. Some examples of operation activities are weekly maintenance of databases, paying invoices or help desk operations activities.
From my experience
  • Programs are much larger than projects.
  • They are made up of many projects and on going activities such as operation type activities.
  • Programs are similar to projects as they consume resources, incur cost and produce deliverables.
  • Programs are more complex and include repetitive operation type activities such as maintenance work, facility administration etc. Programs are funded typically on a fiscal year basis.
  • Projects in general are more time focused than programs.
  • Tools for planning and managing projects, together with other concepts, can be extended to the development and management of programs.
Need of Program Management
  • Overall co-ordination
  • Company wide standardization
  • Improve communication
  • Monitoring
  • Management Reporting
PMO Objectives
  • Develop a project tracking application (monitoring, controlling and reporting all project activities)
  • Time Tracking
  • Develop Project Management Processes
  • Training program
  • Risk Management Process
Process Management
  • Project approval processes
  • Planning and estimation processes
  • Project management methodology: PMI or ?
  • Structuring of projects into phases and modules
  • Set of formal deliverables that should be produces
  • Common Terminology
  • Risk Management process
  • Dependency Management process
  • Issue Management process
  • Monitoring processes
Risk Management
  • Risk identification and documentation
  • Risk evaluation in terms of impact and probability
  • Risk response planning
  • Risk response control
Time Tracking
  • Tracks number of hours being spent on a project
  • Gives visibility on projects being worked on
  • Identifies which projects are getting the priority needed
Reporting
  • Collecting weekly status reports
  • Time reporting for managers
  • Portfolio reporting to project sponsors
  • Reporting for IT Steering Group
Training
  • Improve performance
  • Exposure to all areas of knowledge
  • Incentive
Portfolio Management
  • Portfolio management is managing projects governed by variables influenced by the market, funding, resource and legal requirements. Here, in this context, priority management is very important.
Recommendation
  • Building a PMO takes time
  • Recommend to start one step at a time
  • It requires continuous improvement of project management policies and tools
  • Relationships with peers at other institutions and organizations and share ideas

Using PERT for estimating tasks

A straightforward approach to estimating task duration is the PERT (Program Evaluation Review Technique) weighted average method. This technique calculates task duration using a weighted average estimate, allowing for the consideration of various types of estimates—such as probabilistic values, ranges, and areas with limited definition.

The method is based on the Beta distribution model, which is well-suited for modeling events constrained within a defined interval of minimum and maximum values. Because of its ability to describe task completion times within specific bounds, the Beta distribution is widely used in PERT, CPM, and other project planning and control systems.


The term weighted average means that the equation uses weighted factors to calculate the expected task duration.

The equation and process modelling a task for PERT is the following
E=(O+4M+P)/6 (equation) 
E= Expected Value 
O= Optimistic Value (this is equivalent to a minimum value) 
M= Most Likely Value 
P= Pessimistic Value (this is equivalent to a maximum value)

(i) Fist, acquire estimates for the pessimistic value, most likely value and optimistic value time to completion. For example, let's suppose that: P=20 programmer days M=12.5 programmer days O=10 programmer days

(ii) Then, using the "PERT Weighted Average" equation: E=[(10+4(12.5)+20]/6 = 13.333 programmer days = expected task duration = mean value.

PERT Distribution background

The PERT distribution is a probabilistic model, based on Beta Distribution, and it derives its estimates based on the probability of occurrence (i.e., chance or possibility - if an event is likely to happen, we say it is probable. On the other hand, if it is not likely to happen, we say it is improbable. Directly or indirectly, probability of occurrence plays a role in the all activities. Probability of occurrence of any event will be a number between 0 and 1. Events that are unlikely will have a probability near 0, and events that are likely to happen have probabilities near 1).

The Beta Model is a flexible yet continuous distribution, defined on the interval (0, 1), that places value on the event itself and the interval between events. Because it accounts for a degree of randomness, it is highly useful in determining likely event durations (time estimates for tasks).  In other words, PERT can derive a task duration with a high probability of accuracy based on three values provided by experts estimates (pessimistic, optimistic and most likely). But, it’s still an estimate because it is only as good as the estimates used in the computation.

Probability Density Function Graphical Profiles
The Beta Distribution is parameterized by two positive shape parameters, denoted by alpha and beta. It can take on different shapes depending on the values of the two parameters. The domain of the beta distribution can be viewed as a probability to describe the distribution of an unknown probability value. The range depends on the chosen shape parameters.


Typically, the general form of a distribution model is given in terms of location and scale parameters. The Beta function is different in that the general distribution model is defined in terms of the lower and upper bounds. However, the location and scale parameters can be defined in terms of the lower and upper limits as follows:

location = a
scale = b – a

Location and scale parameters

These parameters, location and scale, are used in modeling applications.
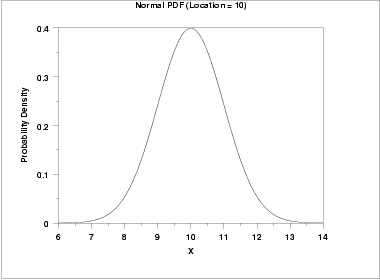
The effect of the location parameter is to translate the graph, relative to the standard normal distribution, 10 units to the right on the horizontal axis. A location parameter of -10 would have shifted the graph 10 units to the left on the horizontal axis. That is, a location parameter simply shifts the graph left or right on the horizontal axis.
The effect of a scale parameter greater than one is to stretch the Probability Density Function. The greater the magnitude, the greater the stretching. The effect of a scale parameter less than one is to compress the function.
The compressing approaches a spike as the scale parameter goes to zero. A scale parameter of 1 leaves the function unchanged (if the scale parameter is 1 to begin with) and non-positive scale parameters are not allowed.
The standard form of any distribution is the form that has location parameter zero and scale parameter one.

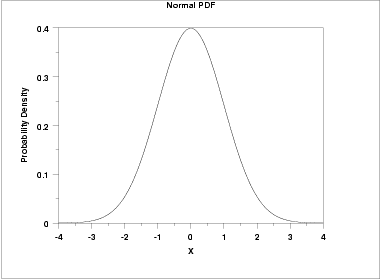
Ex.1: the following graph has a location of 0 and scale of 1.

graph of probability density function for a standard normal distribution

Ex.2: the following graph has a location of 10 and scale of 1.

graph of probability density function for a normal distribution
 with a location parameter of 10 and scale parameter of 1

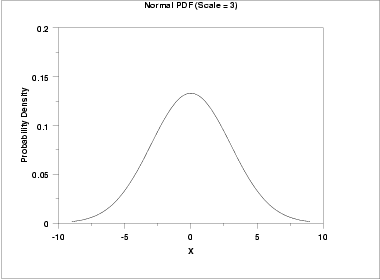
Ex.3: the next plot has a scale parameter of 3 (and a location parameter of zero). The effect of the scale parameter is to stretch out the graph. The maximum y value is approximately 0.13 as opposed 0.4 in the previous graphs. The y value, i.e., the vertical axis value, approaches zero at about (+/-) 9 as opposed to (+/-) 3 with the first graph.

graph of normal PDF with a scale parameter of 3

Ex.4: In contrast, the next graph has a scale parameter of 1/3 (=0.333). The effect of this scale parameter is to squeeze the function. That is, the maximum y value is approximately 1.2 as opposed to 0.4 and the y value is near zero at (+/-) 1 as opposed to (+/-) 3.
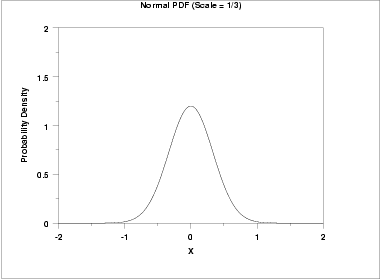
graph of normal PDF with a scale parameter of 1/3

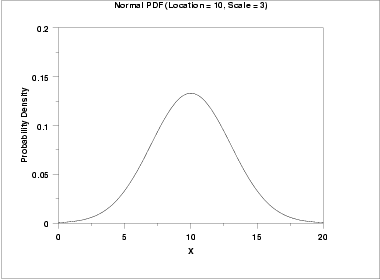
Ex.5: The following graph shows the effect of both a location and a scale parameter. The plot has been shifted right 10 units and stretched by a factor of 3.

graph of normal PDF with location parameter of 10 and scale 
 parameter of 3

The Beta distribution in its standard form ranges from zero to one and takes a wide range of shapes (see the Probability Density Function Graphical Profiles graph on top). Moreover, it can an also be rescaled and shifted to create distributions with a wide range of  shapes and  over any finite range for various applications. For example, it’s used to model expert opinion in the form of the PERT distribution.
The PERT distribution comes out of the need to describe the uncertainty in tasks during the development of a complex project having thousands of tasks. Estimates were needed to be made intuitively, quick and consistent in approach.
The Beta distribution can be rescaled to model a variable that runs from a to b by using the following formula:
x = a + B(a ,b) * (b - a)
This is the four-parameter version of the Beta distribution. A version of this four-parameter Beta distribution is called a PERT distribution and makes the assumption that the mean = (minimum + 4*most likely + maximum) / 6. The default value of 4 scales the height of the distribution. This extra equation allows the four parameters to be determined from three input values: the minimum, most likely and maximum, which makes it ideal for modeling expert opinion of a variable's uncertainty.

Mean= (Min+Max+4*Mode)/(4+2)

Using the three point estimation, estimates of the mean, standard deviation and variance can be obtained:
Expected Time (ET) = ( Optimistic + 4 x Most likely + Pessimistic ) / 6
Expected time (ET) = ( Min + 4 x Most likely + Max) / 6
Standard Deviation (SD) = (Max-Min)/6
Variance (V) = =SD**2 (Standard Deviation squared)

Table Example

List of all tasks lying on the critical path of a project
Tasks
Min
MLT
Max
ET
SD
V
Task A


Task B


Task C


(All time durations are estimates).

Legend
-Min = Optimistic time is generally the shortest time in which the activity can be
completed.
-Most Likely Time (MLT) is the completion time having the highest probability.
-Max = Pessimistic time is the longest time that an activity might require.
-SD (Standard Deviation) is the average deviation form the estimated time (as a general rule, the higher the SD is the greater amount of uncertainty exists).
-V (Variance) reflects the spread of a value over a normal distribution (the SD and V will be useful in determining the probability of the project meeting a desired completion date).
ET = Expected Time.

(Ref. NIST/SEMATECH e-Handbook of Statistical Methods)

PROJECT OPPORTUNITIES FROM CAUSE-EFFECT CASE ANALYSIS

An opportunity might arise as a result of analyzing the cause-effect of a specific case.
For example, a company, due to new business, is experiencing an exponential increase in the volume of their transactions.

As a consequence, it’s having difficulties managing and, most of all, executing all business transactions, especially those ones that are date and time sensitive. This is because its present IT system is being gradually overloaded and is having an impact on performance.

In this case, a high level presentation of the problem could be:

CASE: A general description of the case.

CAUSE: A description of how business increase is overloading the present IT system.

EFFECT: A description of how overloading the present system is causing a decrease in performance and causing gradual saturation.

IMPLICATION: A description of the consequences (e.g., the company will not be able to mange new or more incoming business due to the effect).

Analyzing the solution:

Analyzing the solution requires serious thinking on the effect, and to start discussing what is needed to resolve it, i.e., providing a few options.

Possible outcome after analyzing the problem might be:
(in order to keep up with increasing demands)
  • Upgrade the present IT system to handle the new volume capacity 
  • Migrate to a new IT system with different technology 
The next step is to start analyzing what is required to satisfy the needs. The needs are then translated into requirements and they will serve as the basis for the project plan. This will reduce the effort of determining how best to meet requirements. They may be written as a statement of work (SOW).

THE NEEDS/REQUIREMENTS LIFE CYCLE

Specifying what the project should accomplish is not an easy task and is not to be taken for granted that everything is clear. It's easy to misunderstand requirements and transform the whole project into a tragedy.

What causes the need for requirements?

Well, something has to happen to trigger it...maybe a cause-effect situation, or a change request for something or an action that causes some changes. 

For example, let's suppose that a company expands its offices throughout the country, and as a result of this expansion they need to enhance their information system and improve communication performance. From this situation a need emerges and, in order to meet these needs (system and human), it must be recognized through conscientious effort. Asking questions, from both points of views (company and customers), on the cause and, consequently, on the need will help, and it might be best to establish procedures for identifying these needs in a systematic way. Also, it's important to give special attention to focusing on anticipating needs, and not just on the existing needs. Anticipating needs can be accomplished with a two-hour brainstorming session. This session is useful to develop ideas of what future needs might be. This forecasting is the scenario building.

Once the need is recognized, it must be clearly articulated. This entails an in-depth scrutiny of the recognized need. Look also underneath the surface, so as not to lose sight on reality. The face value is fine, but don't neglect the rest. Articulating the need has a practical side too; it serves as the basis for the development of functional requirements, by stipulating in concrete terms what has to be done to achieve it.

To minimize the risk of doing a poor job in articulating the need, it's best to:
(i) ask those who have the need to define it as clearly as possible,
(ii) ask a full set of questions about the need (information, curiosity, data,...),
(iii) carry out whatever research is necessary to better understand the need,
(iv) in view of insights gained in the first three steps, try to formulate the need the best way you can,
(v) ask the customer to respond to the formulation of the need and revise accordingly.

Carry out the above steps only by working closely with the customers, getting their reactions to the newly articulated needs, and revising the needs statement to reflect customers desire.

After the needs have been carefully defined, it's possible to use them as the basis for developing a project plan. This is done by formulating the needs as functional requirements.

Functional requirements describe the characteristics of the deliverable in ordinary non-technical language, i.e., what emerges from the project. Here it's possible to use graphic images to strengthen its contents.

They should be understandable to the customers, and customers should play a major direct role in their development.

While functional requirements are designed to assure that customers know what they are getting out of a project, technical requirements are written for the technical staff. They describe the features of the deliverable in detailed technical terms (such as physical dimensions and performance specifications). They offer project staff guidance on what they should be doing on the project. Because of their technical nature, technical requirements are often incomprehensible to the customers, who lack the training to know what they mean.

In a software project, for example, the functional requirements may stipulate that a data base system will be developed to allow access to a finacial data through remote access; the corresponding technical requirements would spell out the architecture of the data structure, the language in which the data in which the data base management system will written, the hardware on which the system will run, telecommunications protocol that should be used, and so forth....

Project requirements are important for two reasons
(i) They are a tangible embodiment of the customer's needs (needs emerge, needs recognition, needs articulation, and then they are translate into requirements, which serve as the basis for the project plan). This will reduce the effort of determining how best to meet requirements.
(ii) They define the project team's obligation to the customers.

Requirements also describe the team's responsibilities. Projects that run under contracts, the requirements may be written as a statement of work (SOW), and compliance or non compliance with the contract is determined by resolving whether the contractor has fulfilled the SOW.

A SIMPLE EXAMPLE OF A GLOBAL WORK MODEL

Many companies have activities all over the world and need to maintain a company wide standardization and an overall co-ordination through on-going processes for monitoring, controlling and reporting all activities. These on-going processes are important in order to:
  • maintain an optimal balance of work load,
  • maximize results (profits),
  • minimize risks,
  • optimize use of resources, and
  • make improvements in communication.
This can be accomplished with an integrated global framework that will serve as the basis for providing on-going feedback, hence, allowing alignment and adjustment of changes through a structured and distributed effort system.

This framework is an on-going "process-improvement-process" management system that serves, most of all, as the point of reference for all project/engagement management activities. It should include things such as:
  • how to set up a project, 
  • project approval processes, 
  • planning and estimation techniques, 
  • management methodology (structuring and managing projects throughout its life cycle, set of formal deliverables, common terminology, etc.), 
  • risk management process, 
  • issues management process, 
  • etc. 
The process-improvement-process management system manages elaborates feedback from the global team to continuously produce output improving processes, communication and performance and, moreover, assuring alignment within the framework.

Cultural differences should not constitute a problem. Differences can be overcome with experience, understanding and flexibility.

A SIMPLE WAY OF SIZING SOFTWARE APPLICATIONS

Applications are software programs designed to perform functions for users. They use operating system services and other supporting programs to perform a designated function.

Before developing an application, it would be nice to have an estimate of its size in terms of effort and/or costs.

Applications can be big and complex or small and simple. 

An application that needs to interface and interact with users can be characterized by a certain number of elements such as wire-frames (or user interfaces), use cases, business rules, data tables, reports, and correspondences. The size of an application can be determined by the number of these elements. The table below describes a hypothetical example.

Application
 Estimated Number of Elements
Wire-frames
Use Cases
Business Rules
Data Tables
Reports
Correspondences
10
50901001015
Estimated effort to develop one element of simple complexity level in man-days
3
5
3
3
2
2
Development Effort (man-days)
30
250
270
300
20
30
Estimated effort to capture one element during the analysis phase of simple complexity level in man-days
3
3
3
3
1
1
Analysis Effort (man-days)
30
150
270
300
10
15
Total Effort (man-days)
60
400
540
600
30
45

Legend of elements:
-Wire-frames are user interfaces and it’s the way the user communicates with the application.
-Use Cases describe how a user interacts with the application in a procedural way.
-Business Rules govern the flow of procedures and data.
-Data Tables are the data required for the application to perform its function.
-Reports are printable information.
-Correspondences can be notes, messages, and emails.

N.B.- The numbers in the table above do not refer to any particular industry standard, they are all hypothetical numbers just for calculation and illustration purposes.

By introducing hypothetical unit rates per day it’s possible to calculate the relative and total costs.

-Development unit rate per day = $300 
-Analysis unit rate per day = $500

Putting data in table format:

Costs
Total Effort Development in man-days
900
Developers rate per day in $
300
Developers Cost in $
270000
Total Effort Analysis in man-days
775
Analyst rate per day in $
500
Analysts Cost in $
387500
Total Cost in $
657500

All data in this example is hypothetical. For better accuracy, it’s possible to add more variables and factors to this approach.

PROJECT MANAGEMENT


In general, before defining a project, specifying what it should accomplish might help. But, this is not an easy task and things should not be taken for granted that everything is clear.

A project is the need to achieve something such as a new product, service or prototype, or the consequence of the need to achieve something.

Something has to happen to trigger a need, for example, a cause-effect situation, a change request for something or an action that causes some changes.

Once the need is recognized, it must be clearly articulated. This entails in-depth scrutiny of the recognized need. Articulating the need has a practical side too, that is, it serves as the basis for the development of requirements by stipulating in concrete terms what has to be done to achieve it.

After the need has been carefully defined, it's possible to use it as the basis for developing a project plan. This is done by formulating the need as functional requirements, that is, the characteristics of the deliverable in ordinary non-technical language, i.e., what emerges from the project.

While functional requirements describe what has to be done, technical requirements are designed for the technical staff offer project staff guidance on what they should be doing on the project.

Once the functional and technical requirements have been clearly defined, that is, what and how to do things, there is still the need to know how long will it take to realize the project and how much will it cost. These three aspects in project management are the scope, time and budget, and are known as the triple constraint triangle. The scope is what to be achieved in terms of expectations, time is the duration of the project and it is an estimate, and budget is the cost of the project and it's also an estimate. Balancing these three aspects can impact the quality, results, cost and/or duration of the project.

Defining a project

A project is a temporary and goal‑driven endeavor designed to deliver a unique product, service, or result. It is composed of specific, non‑repetitive activities, requires allocated resources, incurs costs, and produces clearly defined deliverables within a set timeframe.

Variance At Completion

In project management, variance represents the difference between what was planned and what actually occurred . Cost variance, in particul...

☀️

☀️

Quadratic Equation Solver with Graph

Quadratic Equation Solver with Graph

Enter coefficients (a, b, c) for ax² + bx + c = 0: